Value at Risk and Conditional VaR by simulation
Problem
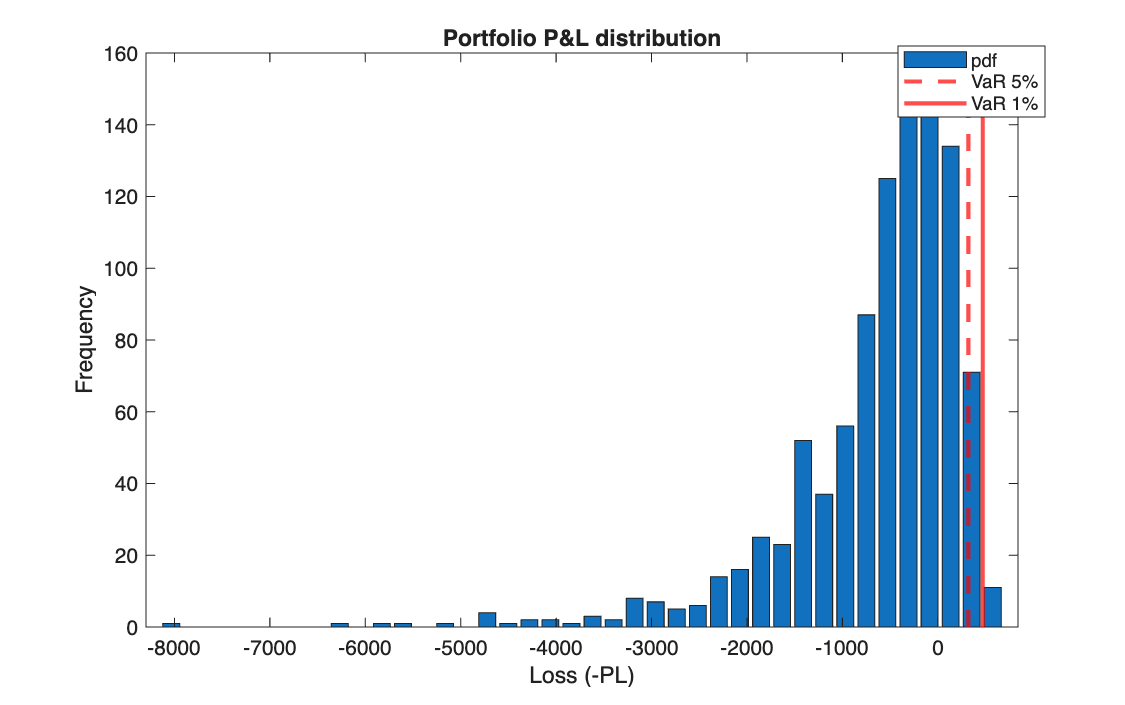
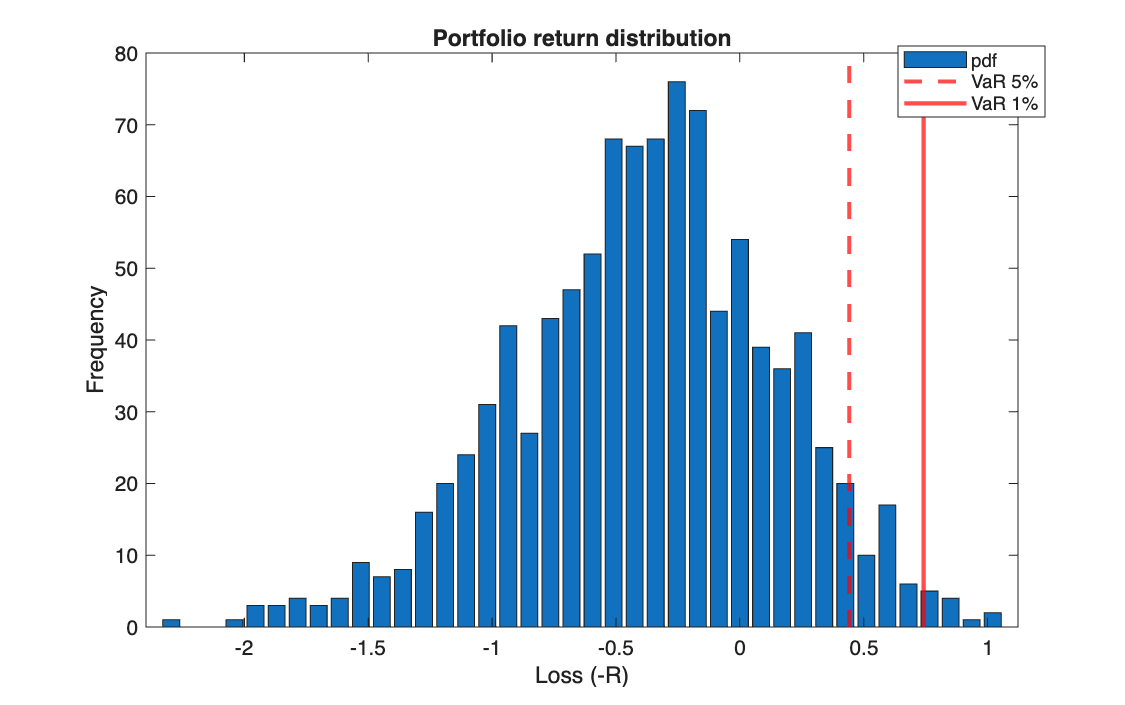
A portfolio of five stocks is worth 900 today. Simulate 1,000 scenarios of log-normal prices at the horizon, compute the profit and loss distribution, and estimate its Value at Risk at 5% and 1% (exercise 137) and its Conditional Value at Risk at 5% (exercise 138).
Method
Prices at the horizon are \(P_T = P_0\, e^{R}\) with \(R \sim \mathcal{N}(0, 1)\) for each stock, and \(PL = V_T - V_0\). With the \(m\) simulated P&L values sorted from the worst:
\[
\text{VaR}_\varepsilon = -PL_{(k)}, \qquad
\text{CVaR}_\varepsilon = -\frac{1}{k}\sum_{i=1}^{k} PL_{(i)}, \qquad k \approx \varepsilon\, m
\]
VaR is the loss exceeded only in the worst \(\varepsilon\) of scenarios; CVaR is the average loss in those scenarios.
Code
clear all, clc

%% 1

n = 5;   m = 1000;

P0 = [7 9 24 19 15];        % current prices
q  = [20 20 10 10 10];      % allocation (number of shares)
V0 = q * P0';               % initial portfolio value

R   = randn(m, n);          % simulated returns (standard normal)
P_T = P0 .* exp(R);         % future prices (log-normal): P_T = P0*e^R
V_T = P_T * q';             % future portfolio values (m x 1)

PL_T = V_T - V0;            % Profit & Loss
R_T  = log(V_T / V0);       % future portfolio return

save('PortPLandRet.mat', 'PL_T', 'R_T');

%% 2

PL_sort = sort(PL_T);       % increasing order: the first ones are the worst losses
RT_sort = sort(R_T);

% epsilon = 0.05
N5 = floor(0.05 * m) + 1;
VaR_PL_5 = -PL_sort(N5)
VaR_RT_5 = -RT_sort(N5)

% epsilon = 0.01
N1 = floor(0.01 * m) + 1;
VaR_PL_1 = -PL_sort(N1)
VaR_RT_1 = -RT_sort(N1)

%% 3

nbins = 40;

figure(1)
F_Empirical_pdf(-PL_T, nbins)
hold on
xline(VaR_PL_5, '--r', 'LineWidth', 2)
xline(VaR_PL_1, '-r',  'LineWidth', 2)
xlabel('Loss (-PL)'); ylabel('Frequency'); title('Portfolio P&L distribution')
legend('pdf', 'VaR 5%', 'VaR 1%')

figure(2)
F_Empirical_pdf(-R_T, nbins)
hold on
xline(VaR_RT_5, '--r', 'LineWidth', 2)
xline(VaR_RT_1, '-r',  'LineWidth', 2)
xlabel('Loss (-R)'); ylabel('Frequency'); title('Portfolio return distribution')
legend('pdf', 'VaR 5%', 'VaR 1%')
clear all, clc

% Point 1

    % Parameters
    n = 5;
    m = 1000;
    epsilon = 0.05;
    P0 = [7 9 24 19 15];
    q  = [20 20 10 10 10];
    V0 = q * P0';

    % Simulation
    R   = randn(m, n);
    P_T = repmat(P0, m, 1) .* exp(R);
    V_T = P_T * q';

    % P&L
    PL_T = V_T - V0;
    R_T  = log(V_T / V0);

    % Risk Measures
    PL_T_sort = sort(PL_T);
    Nepsilon  = round(epsilon * m); % round, because when epsilon*m is not an integer
                                    % the quantile index must still point to an element

    Q_PL_T  = PL_T_sort(Nepsilon);

    VaR_PL  = -Q_PL_T
    CVaR_PL = -mean(PL_T_sort(1:Nepsilon))
import numpy as np
import matplotlib.pyplot as plt
from scipy.io import savemat
from F_Empirical_pdf import F_Empirical_pdf

# %% 1
n = 5
m = 1000

P0 = np.array([7, 9, 24, 19, 15])       # current prices
q = np.array([20, 20, 10, 10, 10])      # allocation (number of shares)
V0 = q @ P0                             # initial portfolio value

R = np.random.randn(m, n)               # simulated returns (standard normal)
P_T = P0 * np.exp(R)                    # future prices (log-normal): P_T = P0*e^R   (P0 is applied to every row)
V_T = P_T @ q                           # future portfolio values

PL_T = V_T - V0                         # Profit & Loss
R_T = np.log(V_T / V0)                  # future portfolio return

savemat('PortPLandRet.mat', {'PL_T': PL_T, 'R_T': R_T})

# %% 2
PL_sort = np.sort(PL_T)                 # increasing order: the first ones are the worst losses
RT_sort = np.sort(R_T)

# epsilon = 0.05
N5 = int(np.floor(0.05 * m)) + 1        # position in MATLAB numbering (51)
VaR_PL_5 = -PL_sort[N5 - 1]             # -1: Python counts from 0
VaR_RT_5 = -RT_sort[N5 - 1]
print("VaR_PL_5 =", VaR_PL_5, " VaR_RT_5 =", VaR_RT_5)

# epsilon = 0.01
N1 = int(np.floor(0.01 * m)) + 1
VaR_PL_1 = -PL_sort[N1 - 1]
VaR_RT_1 = -RT_sort[N1 - 1]
print("VaR_PL_1 =", VaR_PL_1, " VaR_RT_1 =", VaR_RT_1)

# %% 3
nbins = 40

plt.figure(1)
F_Empirical_pdf(-PL_T, nbins)
plt.axvline(VaR_PL_5, color='r', linestyle='--', linewidth=2, label='VaR 5%')   # MATLAB: xline
plt.axvline(VaR_PL_1, color='r', linestyle='-', linewidth=2, label='VaR 1%')
plt.xlabel('Loss (-PL)'); plt.ylabel('Frequency'); plt.title('Portfolio P&L distribution')
plt.legend()                            # shows the labels given above

plt.figure(2)
F_Empirical_pdf(-R_T, nbins)
plt.axvline(VaR_RT_5, color='r', linestyle='--', linewidth=2, label='VaR 5%')
plt.axvline(VaR_RT_1, color='r', linestyle='-', linewidth=2, label='VaR 1%')
plt.xlabel('Loss (-R)'); plt.ylabel('Frequency'); plt.title('Portfolio return distribution')
plt.legend()                            # shows the labels given above
plt.show()
import numpy as np

# %% Point 1

# Parameters
n = 5
m = 1000
epsilon = 0.05
P0 = np.array([7, 9, 24, 19, 15])
q = np.array([20, 20, 10, 10, 10])
V0 = q @ P0

# Simulation
R = np.random.randn(m, n)
P_T = np.tile(P0, (m, 1)) * np.exp(R)   # MATLAB: repmat(P0, m, 1) .* exp(R)
V_T = P_T @ q

# P&L
PL_T = V_T - V0
R_T = np.log(V_T / V0)

# Risk Measures
PL_T_sort = np.sort(PL_T)
Nepsilon = round(epsilon * m)           # 50: the quantile index must point to an element

Q_PL_T = PL_T_sort[Nepsilon - 1]        # MATLAB: PL_T_sort(Nepsilon)   (-1: Python counts from 0)

VaR_PL = -Q_PL_T
CVaR_PL = -np.mean(PL_T_sort[:Nepsilon])   # MATLAB: mean(PL_T_sort(1:Nepsilon))
print("VaR_PL =", VaR_PL)
print("CVaR_PL =", CVaR_PL)
Results
Both scripts draw the same 1,000 scenarios (random seed 0 when generating this page).
| 5% | 1% | |
|---|---|---|
| VaR on P&L (exercise 137) | 321.34 | 471.58 |
| VaR on log return (exercise 137) | 0.442 | 0.742 |
| VaR on P&L (exercise 138) | 322.88 | |
| CVaR on P&L (exercise 138) | 415.71 |
Takeaways
- On the same scenarios, the two scripts give two different 5% VaRs (321.34 and 322.88)
because they pick different order statistics: the 51st worst loss
(
floor(0.05*m) + 1) against the 50th (round(0.05*m)). With a finite sample, the quantile convention is part of the definition. - CVaR is always at least as large as VaR, because it averages the losses beyond it: here 415.71 against 322.88.
- With log-normal prices the loss is capped at the portfolio value (900), while gains are unbounded: the distribution is strongly asymmetric, which is why a normal approximation of the P&L would be poor.