Mean-CVaR efficient frontier
Problem
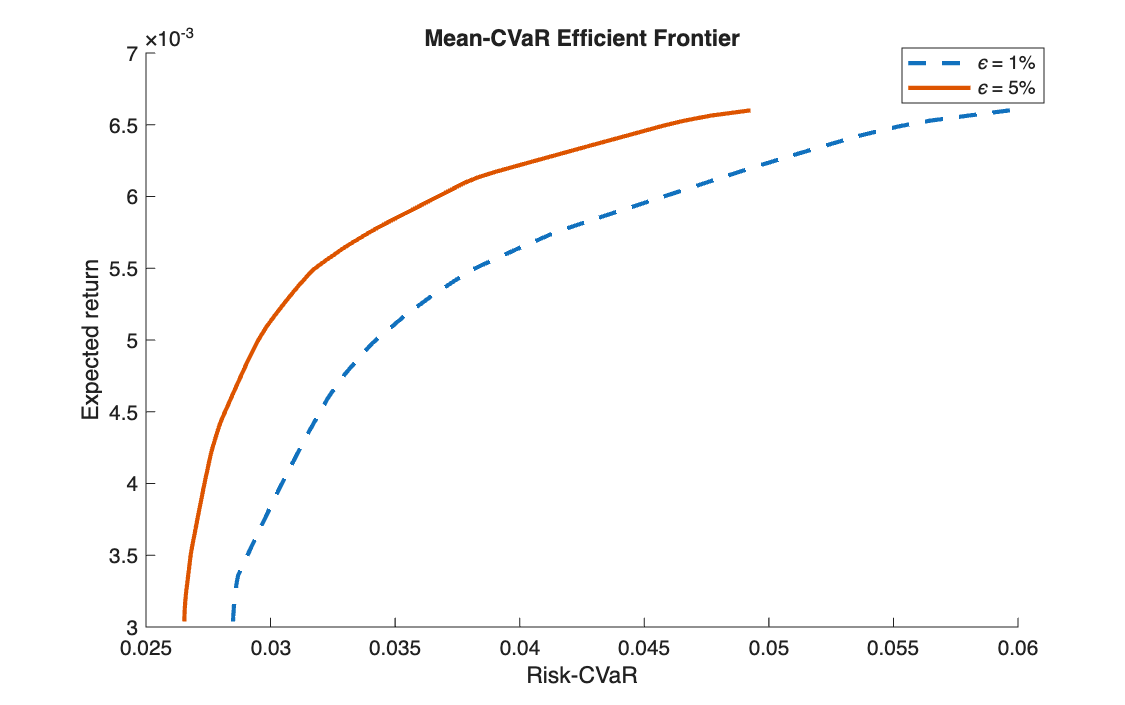
On the same EURO STOXX 50 data, measure risk with the Conditional Value at Risk at 1% and at 5%, and build the two efficient frontiers.
Method
CVaR can be minimised as a linear program (Rockafellar–Uryasev). With a threshold variable \(\alpha\) and one excess variable \(y_t \ge 0\) per scenario:
\[
\min_{x,\,y,\,\alpha}\ \alpha + \frac{1}{\varepsilon T}\sum_{t=1}^{T} y_t
\quad \text{s.t.} \quad
y_t \ge -r_t^\top x - \alpha,\quad
\mu^\top x = \eta,\quad \mathbf{1}^\top x = 1,\quad x \ge 0
\]
At the optimum \(\alpha\) is the VaR and the objective is the CVaR. The same grid of target returns is used for both levels of \(\varepsilon\), so the two frontiers can be compared point by point.
Code
clear, clc

%% 1

A      = readtable('weekly_EUROSTOXX50_price_time.txt');
dates  = A{:, 1};
P      = A{:, 2:end};
RR     = diff(P) ./ P(1:end-1, :);
[T, n] = size(RR);                  % T = weeks, n = stocks

%% 2

mu = mean(RR);

%% 3

A = [-RR, -eye(T), -ones(T,1)];
b  = zeros(T, 1);
lb = [zeros(n+T, 1); -inf];

f1 = [zeros(n, 1); ones(T, 1)/(0.01*T); 1];
f5 = [zeros(n, 1); ones(T, 1)/(0.05*T); 1];

% The eta grid is SINGLE and shared: one solve fixes its lower end (using f5)
Aeq     = [ones(1,n), zeros(1,T), 0];   beq = 1;
x_min   = linprog(f5, A, b, Aeq, beq, lb, []);
eta_min = mu * x_min(1:n);
eta_max = max(mu);

%% 4

N   = 100;
eta = linspace(eta_min, eta_max, N);

%% 5

Aeq_ = [mu,        zeros(1,T), 0;
        ones(1,n), zeros(1,T), 0];

Risk_CVaR_1 = NaN(1, N);
Risk_CVaR_5 = NaN(1, N);

for k = 1:N
    beq_ = [eta(k); 1];
    [~, Risk_CVaR_1(k)] = linprog(f1, A, b, Aeq_, beq_, lb, []);   % CVaR 1%
    [~, Risk_CVaR_5(k)] = linprog(f5, A, b, Aeq_, beq_, lb, []);   % CVaR 5%
end

%% 6

figure(1);
hold on
plot(Risk_CVaR_1, eta, '--', LineWidth=2)
plot(Risk_CVaR_5, eta, '-',  LineWidth=2)
xlabel('Risk-CVaR'); ylabel('Expected return')
title('Mean-CVaR Efficient Frontier')
legend('\epsilon = 1%', '\epsilon = 5%')
print('CVaREF.jpg', '-djpeg')
import numpy as np
import matplotlib.pyplot as plt
from scipy.optimize import linprog

# %% 1
A = np.loadtxt('weekly_EUROSTOXX50_price_time.txt')
dates = A[:, 0]
P = A[:, 1:]
RR = np.diff(P, axis=0) / P[:-1, :]
T, n = RR.shape                         # T = weeks, n = stocks

# %% 2
mu = np.mean(RR, axis=0)

# %% 3
A = np.hstack([-RR, -np.eye(T), -np.ones((T, 1))])   # MATLAB: [-RR, -eye(T), -ones(T,1)]
b = np.zeros(T)
lb = [(0, None)] * (n + T) + [(None, None)]           # weights and excesses >= 0; threshold free

f1 = np.concatenate([np.zeros(n), np.ones(T) / (0.01 * T), [1]])
f5 = np.concatenate([np.zeros(n), np.ones(T) / (0.05 * T), [1]])

# The eta grid is single and shared: one solve fixes its lower end (using f5)
Aeq = np.concatenate([np.ones(n), np.zeros(T), [0]]).reshape(1, -1)
beq = [1]
x_min = linprog(f5, A_ub=A, b_ub=b, A_eq=Aeq, b_eq=beq, bounds=lb).x
eta_min = mu @ x_min[:n]
eta_max = np.max(mu)

# %% 4
N = 100
eta = np.linspace(eta_min, eta_max, N)

# %% 5
Aeq_ = np.vstack([np.concatenate([mu, np.zeros(T), [0]]),
                  np.concatenate([np.ones(n), np.zeros(T), [0]])])

Risk_CVaR_1 = np.zeros(N)
Risk_CVaR_5 = np.zeros(N)

for k in range(N):
    beq_ = [eta[k], 1]
    Risk_CVaR_1[k] = linprog(f1, A_ub=A, b_ub=b, A_eq=Aeq_, b_eq=beq_, bounds=lb).fun   # CVaR 1%
    Risk_CVaR_5[k] = linprog(f5, A_ub=A, b_ub=b, A_eq=Aeq_, b_eq=beq_, bounds=lb).fun   # CVaR 5%

print("CVaR 1%:", Risk_CVaR_1[0], "..", Risk_CVaR_1[-1], "  CVaR 5%:", Risk_CVaR_5[0], "..", Risk_CVaR_5[-1])

# %% 6
plt.figure(1)
plt.plot(Risk_CVaR_1, eta, '--', linewidth=2)
plt.plot(Risk_CVaR_5, eta, '-', linewidth=2)
plt.xlabel('Risk-CVaR'); plt.ylabel('Expected return')
plt.title('Mean-CVaR Efficient Frontier')
plt.legend(['epsilon = 1%', 'epsilon = 5%'])
plt.savefig('CVaREF.jpg')
plt.show()
Results
| Lowest CVaR | Highest CVaR | |
|---|---|---|
| \(\varepsilon = 5\%\) | 2.65% | 4.93% |
| \(\varepsilon = 1\%\) | 2.85% | 5.97% |
Weekly figures, over target returns from 0.304% to 0.660%.
Takeaways
- CVaR is the risk measure of this part that is both coherent (it rewards diversification) and linear-programmable.
- The 1% frontier lies to the right of the 5% one: looking deeper into the tail sees larger losses for the same portfolio.
- With 262 weekly scenarios, the 1% tail is only about 3 observations, so the 1% frontier is close to the MaxLoss one.
Comparing the risk measures
The four frontiers of this part use the same 47 stocks and the same 262 weeks:
| Page | Risk measure | Problem type |
|---|---|---|
| Mean-variance | variance | quadratic |
| Mean-MAD | mean absolute deviation | linear |
| Mean-MaxLoss | worst weekly loss | linear |
| Mean-CVaR | average loss in the worst ε of weeks | linear |