Empirical distributions: CDF, histogram and moments
Problem
Build the three basic tools for describing a random variable from data, each as a reusable function: the empirical cumulative distribution function of a discrete variable (exercise 95), the histogram of a sample as an estimate of its density (exercise 99), and the first four moments (exercise 100). The second and third are tested on standard normal samples.
Method
For a discrete variable with values \(x_i\) and probabilities \(p_i\), the CDF sums the probabilities of the values up to \(x\), so the values must be sorted first:
The histogram splits the range \([\min y, \max y]\) into equally spaced bins and counts the observations in each. The moments, with \(\bar{x}\) the mean and \(s\) the standard deviation:
Code
function [x_sort, Emp_cdf] = F_es95(x, p)

% The CDF (Cumulative Distribution Function) must be computed in increasing
% order of x: otherwise cumsum would add up the probabilities in the wrong
% order and the result would be meaningless.

% inputs:    x := random vector (values of the random variable)
%            p := probabilities linked to each element of x
% outputs:   x_sort := vector of the sorted random variables x
%            Emp_cdf := vector of the cumulative probabilities associated with x_sort

[x_sort, Ind_sort] = sort(x);   % example: x = [5, 2, 8]
                                % x_sort    = [2, 5, 8]
                                % Ind_sort  = [2, 1, 3]   (original position of each element)

p_sort = p(Ind_sort);           % reorder the probabilities to follow x_sort (otherwise they would be attached to the wrong values)

Emp_cdf = cumsum(p_sort);       % cumulative sum of the probabilities

stairs(x_sort, Emp_cdf, 'LineWidth', 2)   % plotting the CDF (stairs, because an empirical CDF is piecewise constant)
title('Empirical Cumulative Distribution Function')
xlabel('x')
ylabel('F_X(x)')
% figure

end
clear all, clc

% Point 1
    n = 100000;
    y = randn(n, 1);
    nbins = 4000;
    [xx, N] = F_es99(y, nbins);


function [xx, N] = F_es99(Y, nbins)

% This function computes an histogram of a pdf, given a vector of random outcomes

% inputs:   Y     = vector of random outcomes
%           nbins = number of bar for the histogram

% outputs:  xx = location of each bin
%           N  = number of elements in each bin

Ymin = min(Y); % smallest value of Y
Ymax = max(Y); % largest value of Y
               % together: the range the samples span

binc  = linspace(Ymin, Ymax, nbins); % nbins equally spaced points over [Ymin, Ymax]

[N, xx] = hist(Y, binc); % histogram with one bin centred on each point of binc

bar(xx, N); % bar creates a bar graph with one bar for each element in y

title('empirical probability density function');

end

%
% Goal: answer the question "given a set of random values, how often do
% certain values occur?". The answer is the empirical distribution, shown
% as a histogram.
%
% THE LOGIC IN THREE STEPS:
%
% 1) FIND THE BOUNDARIES
%    min(Y) and max(Y) give the interval that contains all the data.
%    A space cannot be split into equal parts before knowing how big it is.
%
% 2) SPLIT THE SPACE INTO EQUAL PARTS
%    linspace creates 'nbins' equally spaced centres between Ymin and Ymax.
%    Each centre defines a "bin" that collects the values of Y close to it.
%    More bins = more resolution; fewer bins = a coarser view.
%
% 3) COUNT AND DRAW
%    hist assigns each value of Y to the nearest bin and counts them.
%    bar turns the counts into a bar chart:
%    tall bars = frequent values, short bars = rare values.
%
% NOTE: the chart shows the *empirical* distribution, the one actually
% observed in the data, not the theoretical one. With many samples in Y
% the two converge (law of large numbers).
clear all, clc

% Point 1
    n = 1000000;
    x = randn(n, 1);

    [E_x, Var_x, Skew_x, Kurt_x] = F_es100(x)


function [E_x, Var_x, Skew_x, Kurt_x] = F_es100(x)

% Function computing several summary statistics

% Expected value
E_x   = mean(x);        % arithmetic mean
x_    = x - (E_x);      % deviations: how far each observation is from the mean

% Variance
Var_x = mean((x_).^2);  % the variance is the mean of the squared deviations
dev_x = sqrt(Var_x);    % standard deviation (square root of the variance)

% Skewness
Skew_x = mean((x_ ./ dev_x).^3); % deviations divided by the standard deviation (standardisation)
                                 % make the measure unit-free; then cube and average.

% Kurtosis
Kurt_x = mean((x_ ./ dev_x).^4); % same logic as the skewness, with the fourth power (always positive).
                                 % It measures how peaked the distribution is and how heavy its tails are.
                                 % A normal distribution has kurtosis = 3; higher values mean a sharper
                                 % peak and fat tails, lower values a flatter distribution.

end

% alternatively, MATLAB's built-in functions:
% kurtosis(x)
% skewness (x)
% var(x)
import numpy as np
import matplotlib.pyplot as plt


# %% function F_es99

def F_es99(Y, nbins):
    # Histogram of a pdf, given a vector of random outcomes
    # inputs:   Y     = vector of random outcomes
    #           nbins = number of bars
    # outputs:  xx = location (centre) of each bar
    #           N  = number of elements in each bar

    N, edges, bars = plt.hist(Y, nbins)     # MATLAB: [N, xx] = hist(Y, binc); bar(xx, N)
    xx = (edges[:-1] + edges[1:]) / 2       # centre of each bar
    # (MATLAB's hist puts the centres of the first and last bar on min(Y) and max(Y);
    #  plt.hist puts the edges there, so the bars are slightly different)

    plt.title('empirical probability density function')
    return xx, N


# %% Point 1
n = 100000
y = np.random.randn(n)                  # MATLAB: randn(n, 1)
nbins = 4000
xx, N = F_es99(y, nbins)

plt.show()

# The logic in three steps:
# 1) find the boundaries: min and max of the data
# 2) split that space into nbins equal parts
# 3) count the values in each part and draw the bars
# The chart shows the empirical distribution; with many samples it converges
# to the theoretical one (law of large numbers).
import numpy as np


# %% function F_es100

def F_es100(x):
    # summary statistics: mean, variance, skewness, kurtosis

    E_x = np.mean(x)                    # expected value
    x_ = x - E_x                        # deviations from the mean

    Var_x = np.mean(x_**2)              # variance = mean of the squared deviations
    dev_x = np.sqrt(Var_x)              # standard deviation

    Skew_x = np.mean((x_ / dev_x)**3)   # skewness: standardised deviations, cubed, averaged
    Kurt_x = np.mean((x_ / dev_x)**4)   # kurtosis: same, fourth power (normal = 3)

    return E_x, Var_x, Skew_x, Kurt_x


# %% Point 1
n = 1000000
x = np.random.randn(n)

E_x, Var_x, Skew_x, Kurt_x = F_es100(x)
print("E_x =", E_x)
print("Var_x =", Var_x)
print("Skew_x =", Skew_x)
print("Kurt_x =", Kurt_x)

# alternatively, ready-made functions:
# np.var(x), scipy.stats.skew(x), scipy.stats.kurtosis(x, fisher=False)
import numpy as np
import matplotlib.pyplot as plt


def F_es95(x, p):
    # The CDF must be computed in increasing order of x: sort first.
    # inputs:    x := values of the random variable
    #            p := probabilities linked to each element of x
    # outputs:   x_sort  := x sorted in increasing order
    #            Emp_cdf := cumulative probabilities associated with x_sort

    x = np.array(x)
    p = np.array(p)

    Ind_sort = np.argsort(x)            # MATLAB: [x_sort, Ind_sort] = sort(x)   (argsort gives the positions)
    x_sort = x[Ind_sort]

    p_sort = p[Ind_sort]                # reorder the probabilities to follow x_sort

    Emp_cdf = np.cumsum(p_sort)         # cumulative sum of the probabilities

    plt.step(x_sort, Emp_cdf, where='post', linewidth=2)   # MATLAB: stairs (a CDF is piecewise constant)
    plt.title('Empirical Cumulative Distribution Function')
    plt.xlabel('x')
    plt.ylabel('F_X(x)')

    return x_sort, Emp_cdf
Results
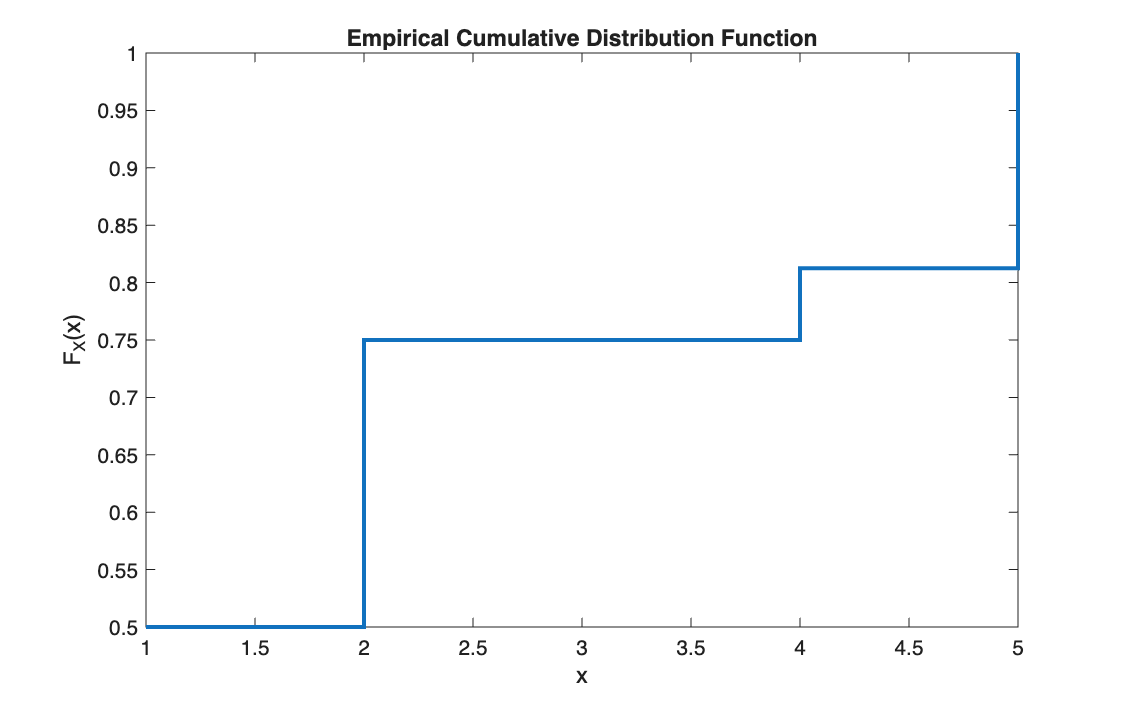
CDF (exercise 95). Values \(x = (2, 4, 1, 5)\) with probabilities \((1/4, 1/16, 1/2, 3/16)\): sorted, the CDF is 0.5, 0.75, 0.8125, 1.
Moments (exercise 100). On one million standard normal draws:
| Sample | Theory | |
|---|---|---|
| Mean | 0.0009 | 0 |
| Variance | 0.9994 | 1 |
| Skewness | 0.0003 | 0 |
| Kurtosis | 3.0042 | 3 |
Takeaways
- An empirical CDF is a step function:
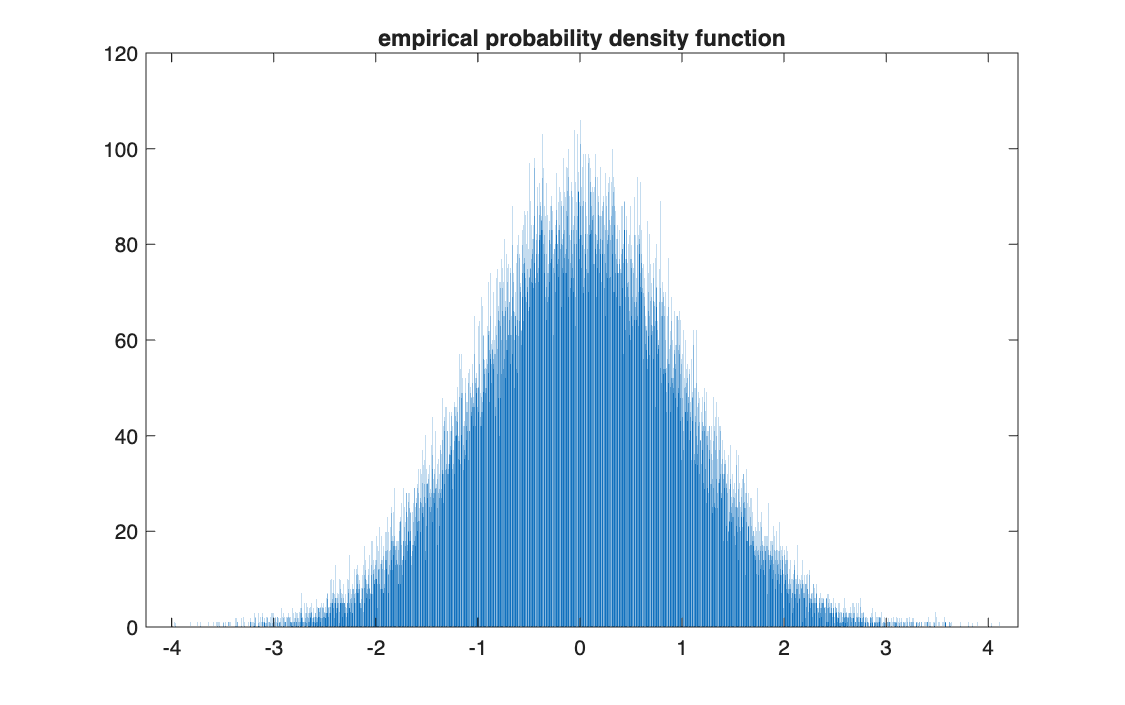
stairs, notplot. - The number of bins is a choice: 4,000 bins on 100,000 draws gives about 25 observations per bin, enough to see the bell shape but visibly noisy.
- Kurtosis is measured against 3, the value of the normal distribution: it is the reference used throughout the rest of this part.