Written exam, 23 June 2026
Three tasks, solved in MATLAB under exam conditions: a yield curve from swap rates, a mean-variance and mean-MAD frontier, and the price of a European option with three methods.
The code below is exactly as submitted. The only changes are the removal of the header line with my student details, the translation of the comments into English, and the removal of the blank line that followed every line of code in the saved files. It was not reviewed before publication; the errors found on review are listed at the end of the page, with the correct numbers, instead of being fixed in the code.
Task 1 · Yield curve from IRS rates
Bootstrap the discount factors from 20 annual swap rates (1.92% at 1 year to 4.09% at 20 years), interpolate the yields on a half-yearly grid, and plot spot and forward rates.
clear all, clc

%% 1
A = readtable('Data_IRS.xlsx');
t = A{:, 1};
z = A{:, 2};
z = z / 100;
[v] = F_Bootstrap(z);
t_int = 0.5 : 0.5 : t(end);
%% 2
[v_int] = F_StructInterYield(t, v, t_int);
[forward_prices,forward_rates] = F_forward(t_int,v_int);
y_int = -log(v_int) ./ t_int
%% 3
figure(1)
hold on
plot(t_int, y_int)
plot(t_int, forward_rates)
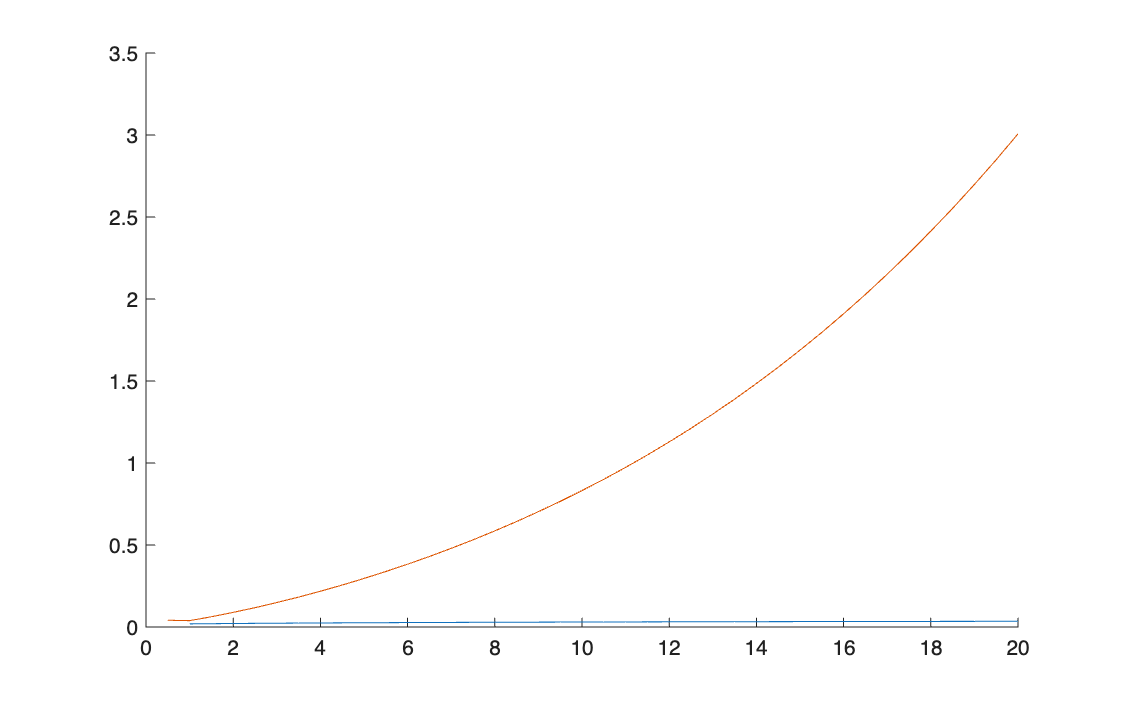
% problem with the forward_rates chart, which does not come out right
% (not saved because wrong) print('G_StrutturaTassi','-djpeg')
The chart as the submitted code produces it: the continuous spot curve (blue, almost flat at this scale) and the "forward rates" (orange), which climb to 300%.
Task 2 · Mean-variance and mean-MAD frontiers
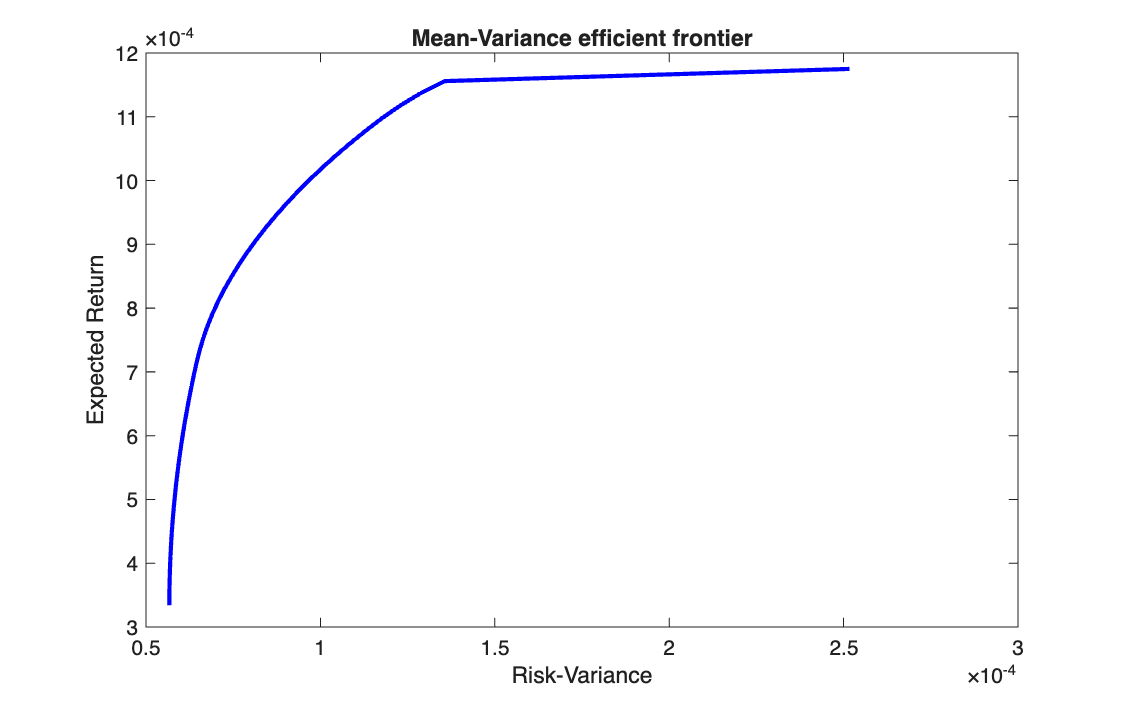
On 12 EURO STOXX 50 stocks and 289 returns, build the mean-variance efficient frontier with 45 target returns, then the mean-MAD frontier.
clear all, clc

%% 1
A = readtable('EuroStoxx50.xlsx');
%% 2
t = A{:, 1};
P = A{:, 2:end};
P_cut = P(1:290, 1:12);
RR = diff(P_cut) ./ P_cut(1:end-1, :);
mu = mean(RR);
sigma = cov(RR);
[T, n] = size(RR);
%% 3
H = 2 * sigma;
lb = [zeros(n, 1)];
beq = [1];
Aeq = [ones(1, n)];
X_min = quadprog(H,[],[],[],Aeq,beq,lb,[]);
eta_min = mu * X_min
eta_max = max(mu)
eta = linspace(eta_min, eta_max, 45);
%% 4
Aeq_ = [mu; ones(1, n)]
for k = 1 : length(eta)
    beq_ = [eta(k); 1]
    [X,Risk_sigma2(:, k)] = quadprog(H,[],[],[],Aeq_,beq_,lb,[]);
end
%% 5
 save('FrontieraMV.xls','Risk_sigma2')
 plot(Risk_sigma2, eta, 'b', LineWidth=2)
 xlabel('Risk-Variance')
 ylabel('Expected Return')
 title('Mean-Variance efficient frontier')
 print('G_FrontieraMV','-djpeg')
%% 6
% plotting the number of stocks against the target return eta would show
% that as the required return eta(k) grows, the number of stocks
% selected falls (down to a single stock, the one with the highest
% return)

%% 7
dev = RR - repmat(mu, T, 1)
eta_2 = linspace(eta_min, eta_max, 100)
A_1 = [dev, -eye(T),
    -dev, -eye(T)]
f_1 = [zeros(n, 1); ones(T, 1)/ T]
b_1 = [zeros(2*T, 1)]
LB_1 = [zeros(n +T, 1)]

Aeq_1 = [mu, zeros(1, T),
    ones(1, n), zeros(1, T)]
for k = 1 : length(eta_2)
    beq_1 = [eta(k); 1]
    Risk_MAD_(:, k) = linprog(f_1,A_1,b_1,Aeq_1,beq_1,LB_1,[])
end
Risk_MAD = Risk_MAD_(1:n)
figure(2)
plot(Risk_MAD, eta_2)
The mean-variance part runs: the frontier goes from the minimum-variance portfolio (mean return 0.033% per period, variance \(5.7 \times 10^{-5}\), 9 stocks) to the best single stock (0.118%).
The mean-MAD part (point 7) stops with an error; see below.
Task 3 · European option: Monte Carlo, binomial tree, Black–Scholes
Price a two-year call and put with \(S_0 = 85\), \(K = 90\), \(r = 6\%\), \(\sigma = 40\%\), by Monte Carlo (100,000 draws), on a 24-step binomial tree, and with the Black–Scholes formula.
clear all, clc

%% 1
K = 90;
S_0 = 85;
r = 0.06;
T = 2;
sigma = 0.4;
N = 24;
n = 100000;
[C, P] = F_Montecarlo(S_0, sigma, r, T, K, n)
%% 2
[call_prices,put_prices, put_call_parity] = F_Binomiale(S_0, T, K, r, sigma, N)
% error: the put price does not come out
%% 3
% Black-Scholes formula
d_1 = (log(S_0 ./ K) + (r + (sigma.^2)/2) .* T) / sigma .* sqrt(T)
d_2 = d_1 - sigma .* sqrt(T)
C__ = S_0 * d_1 - K * exp(-r*T) * d_2
P__ = K * exp(-r*T)*(-d_2)- S_0*(-d_1)
function [call_prices,put_prices, put_call_parity] = F_Binomiale(S_0, T, K, r, sigma, N)
% note: N is the m of the exam text

dt = T / N

% r = log(1 + i)

u = exp(sigma*sqrt(dt))

d = 1 / u

q = (exp(r*dt) - d) / (u - d)

for k = 0 : N

    nodesCall(k+1, N+1) = max(S_0 * u^k *d^(N - k) - K, 0)
    nodesPut(k+1, N+1) = max(K - S_0 * u^k *d^(N - k), 0 )

end

for j = N-1 : -1 :0
    for k = 0 : j
    nodesCall(k+1, j+1) = exp(-r*dt)* (q * nodesCall(k+2, j+2) + (1 - q)*nodesCall(k+1, j+2))
    nodesPut(k+1, j+1) = exp(-r*dt)* (q * nodesPut(k+2, j+2) + (1 - q)*nodesPut(k+1, j+2))
    end
end

call_prices = nodesCall(1,1)
put_prices = nodesPut(1,1)

put_call_parity = call_prices - S_0 + K * exp(-r*T)
| Monte Carlo | Binomial tree, 24 steps | Black–Scholes as submitted | Black–Scholes, correct | |
|---|---|---|---|---|
| Call | 20.9285 | 21.1284 | 49.2335 | 21.0519 |
| Put | 15.8648 | 15.9512 | 49.2335 | 15.8748 |
Monte Carlo and the tree agree with the correct closed form; the submitted formula does not.
Errors found on review
| Task | Where | What is wrong | Effect | Correct result |
|---|---|---|---|---|
| 1 | F_Bootstrap |
z is made a row and repeated down the rows, so the matrix has \(A_{ij} = z_j\) instead of \(z_i\): each equation uses the other maturities' rates |
the curve is too low | 20-year spot 4.22% (annual), not 3.53% |
| 1 | F_forward |
the first forward rate uses forward_prices(k), the last one, instead of forward_prices(1); the others use the spot price v(k) instead of the forward price |
"forward rates" rise to 300% | forward rates between 2.6% and 5.0% |
| 1 | F_StructInterYield |
the 6-month point is before the first maturity (1 year) and is not extrapolated | the curves start at 1 year | minor |
| 2 | point 7 | the loop runs over the 100 targets of eta_2 but reads eta(k), which has 45 |
stops at \(k = 46\) with "Index exceeds the number of array elements" | — |
| 2 | point 7 | linprog is asked only for the solution vector, so Risk_MAD_ stores weights and auxiliary variables, not the MAD; Risk_MAD_(1:n) then takes the first \(n\) entries of one column |
even without the index error, the plotted "risk" would not be the MAD | the MAD is the second output of linprog |
| 3 | Black–Scholes | d_1 is divided by sigma and then multiplied by sqrt(T) instead of divided by sigma*sqrt(T); the prices use d_1 and d_2 directly instead of \(N(d_1)\) and \(N(d_2)\) |
call = put = 49.23 | call 21.0519, put 15.8748 |
The comment in S_OptionPricing.m says the binomial tree does not give the put price. When the
code is run, it does: 15.9512, equal to the put-call parity check.
The correct formulas for all three tasks are on the course pages: bootstrapping, spot and forward curve, mean-MAD frontier, binomial tree.